Houston, we have a problem. It’s a Zika-carrying mosquito.
OK, nobody in space is saying that. But it is true that NASA scientists have created a map to better target future search-and-destroy missions for the deadliest animal on the planet, the female Aedes aegypti mosquito. The blood-sucking females are responsible for the spread of dangerous diseases such as yellow and dengue fevers, chikungunya and now Zika.
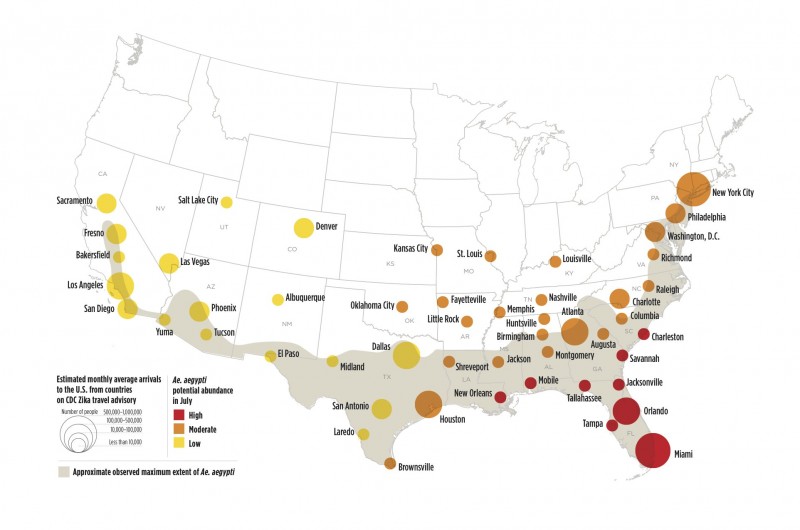
The researchers focused their analysis on 50 cities within or near to the currently known range of the Aedes aegypti in the United States. The resulting map, newly released in the journal PLOS Currents, applies factors such as temperature, amount of rainfall, poverty levels and travel to the United States from Zika-affected areas of the world. Even more, the researchers analyzed the risk for each month in the year.
A glance quickly shows that except for the tip of Texas and a bit of Florida, including the Keys, most areas of the United States have little to no risk during the winter months. That’s the time when colder temperatures and/or a lack of moisture keep mosquito eggs from hatching. Then, as rains and high temperatures begin to gather strength in the Southeast, the risk begins to rise, spreading across the South to California and up into the middle of the country.
By June, nearly all of those 50 cities “exhibit the potential for at least low-to-moderate abundance,” according to the study, “and most eastern cities are suitable for moderate-to-high abundance.”
The cities in the study with the highest potential risk include Miami, Orlando, Tampa, Jacksonville and Tallahassee in Florida; Savannah, Georgia; Charleston, South Carolina; Mobile, Alabama; and New Orleans.
At moderate risk are cities along the eastern coastline, such as New York, Philadelphia and Washington, and then across the country to Kansas City, Oklahoma City and Houston.
“This information can help public health officials effectively target resources to fight the disease and control its spread,” said Dale Quattrochi, NASA senior research scientist at Marshall Space Flight Center in Huntsville, Alabama.
The Marshall research team produced the map in partnership with the National Center for Atmospheric Research in Boulder, Colorado, among others.
The two months with the highest estimated number of travelers returning by air from countries on the Centers for Disease Control and Prevention’s Zika travel advisory are July and August, which corresponds with the summer months when mosquito populations would be highest.
Another factor considered by the researchers was poverty rates, especially in urban areas, a favorite haunt of the Aedes aegypti. Low income correlates with a lack of prevention measures such air conditioning and screens on windows, which are extremely effective methods in preventing Zika transmission.
While most of the model seems in line with expectations of the spread of Zika, “there were some surprises,” said Cory Morin, a NASA postdoctoral program fellow with Marshall’s Earth Science Office. One such surprise was just how far north the Aedes aegypti might spread during the summer months.
“This suggests that the mosquito can potentially survive in these locations if introduced during certain seasons, even if it hasn’t or can’t become fully established,” Morin said.
Predictive models are nothing new for NASA. Over the past 30 years, it has worked with numerous world health organizations to look at the possible spread of such diseases as malaria, plague, yellow fever, West Nile virus, Lyme disease, Rift Valley fever and onchocerciasis, known as river blindness, according to a news release.
The CDC recently updated its maps on Zika-suitable areas of the United States, while an international group of researchers plotted potential environmental hot spots worldwide. In addition to the known areas in the United States, Central and South America, that map shows high risk for areas of sub-Saharan Africa, India, southeastern China and Indonesia.
